
Overlays
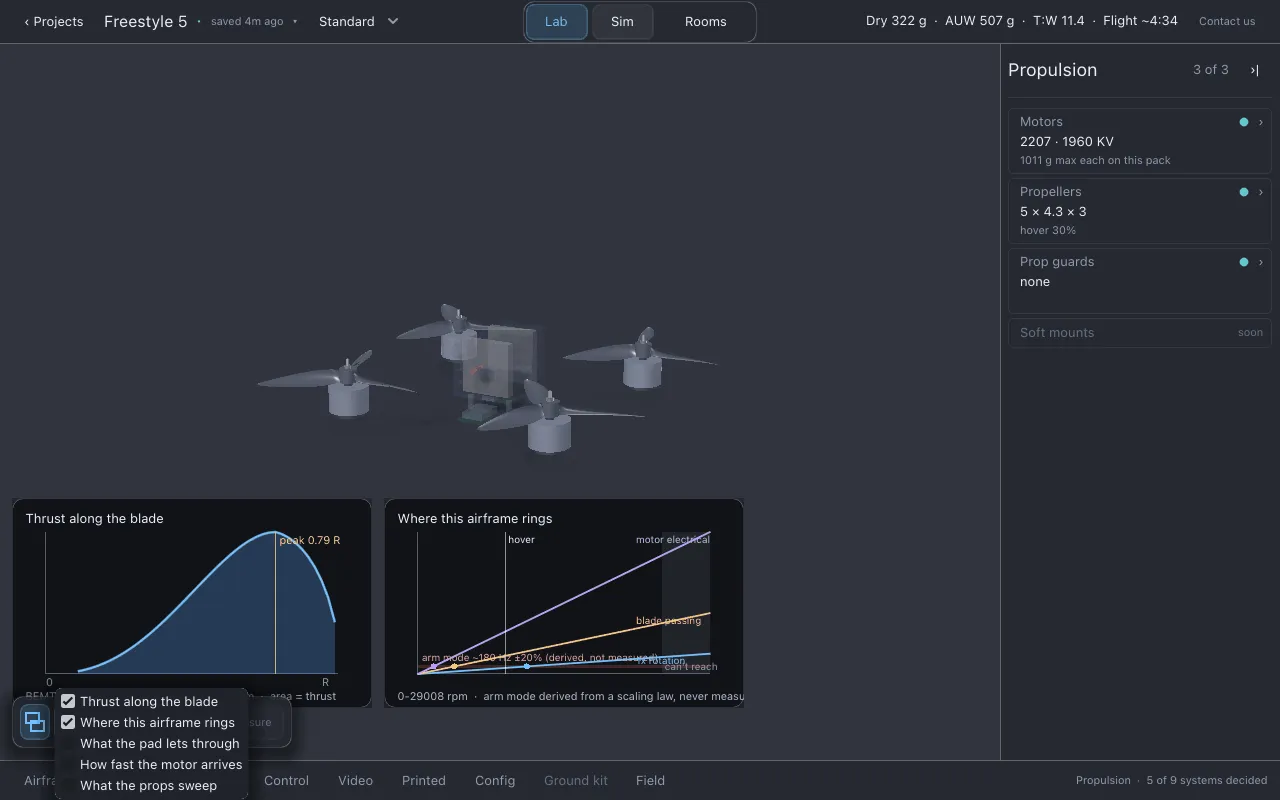
Overlays are small analysis charts drawn over the drone in Lab. Each answers one question about the build you have fitted, and updates as you change parts.
Turning them on
Section titled “Turning them on”At the bottom left of the drone view, Overlays turns the charts on and off. The arrow beside it opens a list where you tick which charts to show. Two are ticked the first time: Thrust along the blade and Where this airframe rings.
Charts are only shown in Lab with the drone on screen. They go away while a page, the frame designer, the blade designer, a bench, Studio, Field or Sim is open.
If the window has no room for another chart, the list refuses it and says so rather than drawing it too small to read. Make the window bigger to fit more.
The five charts
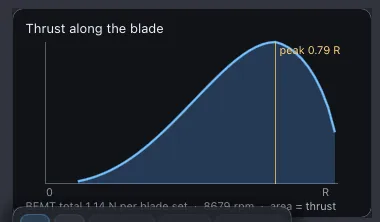
Section titled “The five charts”Thrust along the blade
Section titled “Thrust along the blade”Where along the propeller blade the thrust is made, at the RPM this drone actually hovers at. Radius runs across (as a fraction of the tip radius), thrust density up, and the peak is marked. If the model cannot solve the rotor, the chart says so.
Where this airframe rings
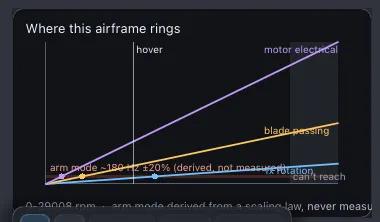
Section titled “Where this airframe rings”At which motor RPMs the frame is likely to vibrate. RPM runs across and frequency up. Three straight lines rise from zero: once per revolution (imbalance), once per blade per revolution, and the motor’s electrical drive. The frame’s own resonance lies across them as a band, not a line, because its frequency is estimated, not measured; the chart says so. Where a line crosses the band, that RPM is marked. A vertical line marks the hover RPM, so you can see whether a crossing is one you fly through or one you sit on.
What the pad lets through
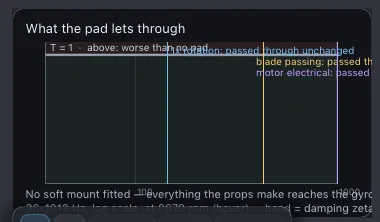
Section titled “What the pad lets through”How much vibration at each frequency reaches the gyro through the motor’s soft mount. Above 1 the pad makes vibration worse (shaded as amplification); below 1 it isolates. This drone’s three vibration frequencies at the RPM it is turning are drawn as vertical lines. The frequency axis is logarithmic. With no pad fitted the curve is flat at 1, and the caption says whether that is because no pad is fitted or because the pad’s figures could not be used.
How fast the motor arrives
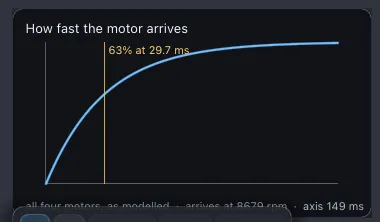
Section titled “How fast the motor arrives”How quickly the motor reaches its RPM after a throttle change: one curve over five time constants, with the 63% point marked. All four motors are the same motor in a build, so it is one curve. If the time constant could not be computed from the motor’s figures, the curve is dashed and the note says it is a fallback value.
What the props sweep
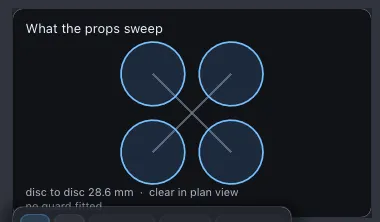
Section titled “What the props sweep”A top-down view of the four propeller discs at their real size and position, the arms under them, any guard rings, and the gaps between disc and disc and between tip and guard. It is a plan view and cannot see height: two discs that overlap here may sit at different heights, so it says the discs overlap in plan, not that the propellers hit.
Reading them
Section titled “Reading them”These charts describe the character of a build. They come from the same model as the rest of Lothal, and none of them carries an error bar. Use them to compare two builds and to see where a problem might be, not as measurements of a real drone.
Related
Section titled “Related”Documentation licensed underCC BY 4.0. Lothal itself is GPL-3.0-or-later.Report a problem.Roadmap.